Skip to Main Content

R and Data Mining: Introduction

These resources have been compiled to address the needs of students enrolled in HINF. 5008: Computational Methods in Health Informatics.

About This Guide

This guide is highly recomended for students enrolled in HINF 5008 - Computational Methods in Health Informatics

The resources provided here aim to help you apply computational methods in your research, while learning more about data-mining topics and how to get help with new tools.

This guide focuses specifically on using the opensource statistical programing language R, but more on other data analytics resources can be found through the Data-Intensive Research LibGuide.

Familiarize Yourself With These Concepts

Getting a better understanding of how the following terms are used will help you as you explore these resources and learn to apply them in your research.

  • Data Science
  • Big Data
  • Machine Learning
  • Data Mining


Data Science

 The Data Science Venn Diagram is Creative Commons licensed as Attribution-NonCommercial.
 The following is a summary based on Drew Conway's Data Science Venn Diagram Article. Read the full write-up here


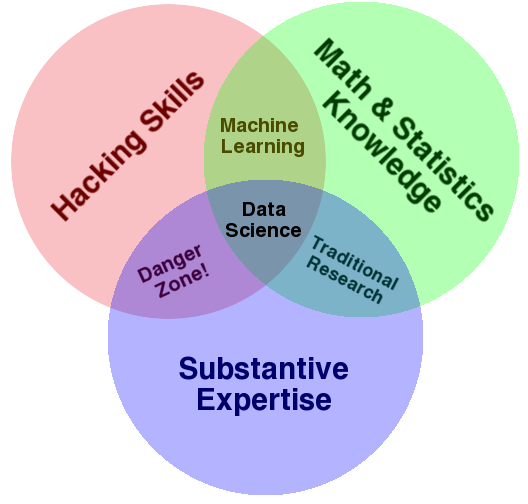
How to read the Data Science Venn Diagram:

The primary colors of data: hacking skills, math and stats knowledge, and substantive expertise

  • Data Science is inherently interdisciplinary in nature and each of these skills are on their own very valuable, but when combined with only one other are at best simply not data science, or at worst potentially dangerous.
  • Data is a commodity traded electronically; therefore, in order to be in this market you need to speak hacker. This does not require a background in computer science. Being able to manipulate text files at the command-line, understanding vectorized operations, thinking algorithmically are the hacking skills that make for a successful data hacker.
  • Once you have acquired and cleaned the data, the next step is to actually extract insight from it. In order to do this, you need to apply appropriate math and statistics methods, which requires at least a baseline familiarity with these tools. This is not to say that a PhD in statistics in required to be a competent data scientist, but it does require knowing what an ordinary least squares regression is and how to interpret it.
  • Substance is the next piece. Data plus math and statistics only gets you machine learning, which is great if that is what you are interested in, but not if you are doing data science. Data Science is about discovery and building knowledge, which requires some motivating questions about the world and hypotheses that can be brought to data and tested with statistical methods. Substantive expertise plus math and statistics knowledge is where most traditional researcher falls. Doctoral level researchers spend most of their time acquiring expertise in these areas, but very little time learning about technology. 
  • The "Danger Zone" is where people, "know enough to be dangerous," and is the most problematic area of the diagram. In this area people who are perfectly capable of extracting and structuring data, likely related to a field they know quite a bit about, and probably even know enough R to run a linear regression and report the coefficients; but they lack any understanding of what those coefficients mean. It is from this part of the diagram that the phrase "lies, damned lies, and statistics" emanates, because either through ignorance or malice this overlap of skills gives people the ability to create what appears to be a legitimate analysis without any understanding of how they got there or what they have created. 


Big Data 

Defining Big Data

Gartner's Definition:

“Big data” is high-volume, -velocity and -variety information assets that demand cost-effective, innovative forms of information processing for enhanced insight and decision making

6 "V"s  of Big Data-- these depend on who's writing the definition, but here's an explanation of those aspects: 

  • These first 3 Vs are commonly agreed upon:
    • Volume – Data volumes are sky-rocketing as the costs of computation, storage, and connectivity resources plummet. As the volume of data grows, we can learn a lot provided we are able to uncover meaningful relationships and patterns.
    • Variety – There is an incredible amount of variety to the data we have available to us today. From streams of text data in social media and geolocation data, to quantitative metrics and demographics, groups are capturing a more diverse set of data than ever. Big Data means bringing it together, which is quite the challenge. 
    • Velocity – Data is coming faster than ever and in some cases, the data's shelf life is very short. This speed can be a great asset, or just be overwhelming. It's a lot of work to take advantage of this speed.
  • These next three Vs are very important, but not always touched upon in definitions of Big Data:
    • Veracity – Uncertainty about the consistency and/or completeness of data and other ambiguities can be serious obstacles to working with data. As a result, basic principles like data quality, data cleansing, master data management, and data governance are critical disciplines when it come to Big Data.
    • Viability – With Big Data you're not just collecting a lot of data, but a lot of multidimensional data that spans an increasingly diverse array of variables. Therefore one must quickly and cost-effectively test and confirm a particular variable’s relevance before investing in the creation of a fully featured model that uses that data. Just because you have a lot of data doesn't mean that it's always useful to you.
    • Value – Big Data must also provide for sophisticated queries along with counter-intuitive and unique insights. The goal is to define prescriptive, precise actions and behaviors without blindly following a predictive model of correlations-- one must examine and understand the interrelationships that the data embodies.

For more on these definitions see Neil Biehn's article in Wired and Gartner's Big Data Definition explained in Forbes

TED on Big Data

Making Sense of Too Much Data Play list of ten presentations given at conferences for the organization, Technology, Entertainment, Design (TED). These talks explore practical, ethical, and visual ways to understand near-infinite data.


Machine Learning


Sometimes integrated with "statistical learning", machine learning refers to a set of algorithmic approaches and tools for modeling and understanding complex data sets (James, 2013). Machine learning "investigates how computers can learn (or improve their performance) based on data. A main research area is for computer programs to automatically learn to recognize complex patterns and make intelligent decisions based on data" (Han, 2012).

Subtypes:

  • Supervised- This is basically a synonym for classification. Training examples are used to supervise the learning of the classification model to make it more accurate.
  • Unsupervised- Essentially a synonym for clustering. The input examples are not class labled, and clustering is used to discover classes within the data. Clustering cannot tell us the semantic meaning of clusters found.
  • Semi-supervised- Class of machine learning techniques that makes use of both labeled and unlabeled examples when learning a model. For example, labeled examples can be used to learn class models, and unlabeled examples can be used to refine the boundaries between classes.
  • Active learning- This approach lets users have an active role in the learning process. For instance, one may ask the user to label an example from a set of unlabeled examples in order to optimize the model quality by acquiring knowledge form human users.

(Han, 2012)


Data Mining


Data mining is an interdisciplinary subject that can be defined in many ways, but has also been referred to as "knowledge mining from data" or Knowledge Discovery from Data (KDD) implying that data mining is an essential step in the process of knowledge discovery and the data life cycle.

More specifically, data mining is a sub-field of computer science that integrates aspects of statistics, machine learning, database systems and data warehouses, along with information retreival in order to leverage the power of various pattern recognition techniques. Typically, data mining tries to either discover or generate preliminary insights into area's where there is little current knowledge available from large datasets.

The data mining process involves data cleaning, integration, selection, transformation, pattern discovery, pattern evaluation, and knowledge presentation.

(Han, 2012)

Other Useful Resource Guides and Pages

Explore these guides for even more help and resources

Visualizing Data

Loading ...